

You have probably read that one of the many good things about OKRs is that it provides structure and clarity to work towards common goals. It helps connect company, teams and individuals’ objectives to measurable results.
 |
| Photo by Garreth Brown via Pexels |
In a previous Beolle article, Herak wrote about HOSKR and OKRs.
In this iteration we will focus on the OKR scoring.
Measuring the “How”
The KRs in OKRs are the Key Results. With them we measure the progress towards the Objectives we have set. So how do we score them in a way that makes sense, and measure the success?
Few “gotchas” before we start
- Grades are an indication where you're going.
- In OKRs, scoring between .6 to .7 is your target. Scores between .8 and 1.0 are rare, meaning they are not the usual. If you find yourself completing all your OKRs within this range then something is not correct, for example, your Objectives are not Ambitious enough, meaning you always knew you (or your company or your team) were going to achieve it without much effort.
- Low grading isn't to be punished.
- Scores matter less than the process. If you are taking too long during the scoring gathering, preventing you, or the team, from “doing”, then reconsider and correct the approach.
- Company-wide scoring enforces the commitment.
- The scoring is a guide of what to keep doing, what to change, what not to keep doing.
- The sweet spot for the amount of KRs within the same Objective is three (3). Having said that, you could have more, if you think that makes sense to your OKR.
- Focus on the results when scoring, meaning on fulfilling the outcome. Needs to be clear why you are giving that grade. Be ready to explain it.
- Always welcome your team members’ opinions.
- Publicly grade organizational OKRs.

How to score the OKRs?
- Have regular meetings to check how the OKRs are doing.
- Place the grading. Where 0 means no progress, and 1.0 means complete.
- Calculate a score for the objective, which is an average from the gradings. Tip: My personal preference is keeping it simple by avoiding different weights. Keeping an equal weight for all will simplify the use of the tool and the reporting.
- Once calculated, the team needs to review the scoring together. Chat about challenges and blockers getting in the way to meet the Objectives. This allows them to identify the areas of improvement, determining if they stay course, or if there are opportunities to pivot.
- Assign to work, teams and individuals to execute, and the cycle begins again.
There are a few ways to work on the scoring. I will stick with the traditional grading scale approach.
You want to review your OKRs frequently. With proper tools, you can log your process as close to real-time as possible. Tracking often will help with accuracy.
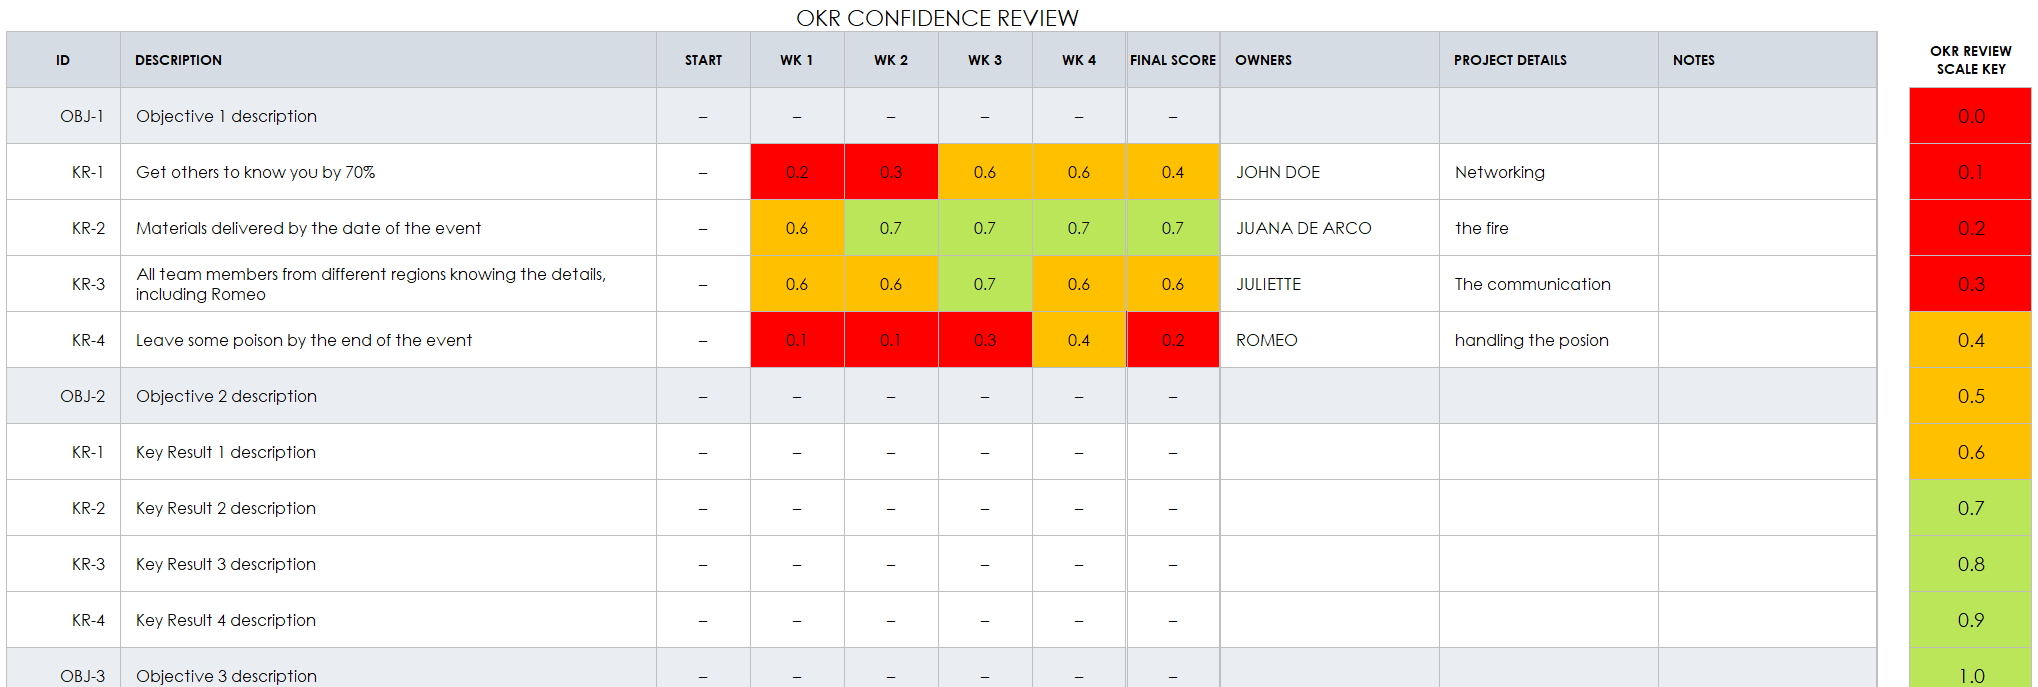
![]() In the traditional grading:
In the traditional grading:
- You score your KRs in a scale of 0.1 to 1.0
- Leverage colours, representing rate of success.
- Green is from 0.7 to 1.0. This is for a status of completed/delivered/DONE.
- Yellow is from 0.4 to 0.6. This is for “progress has been made, but we felt short”
- Red is from 0 to 0.3. This is for “we have failed to make significant progress”
0
0.1
0.2
0.3
0.4
0.5
0.6
0.7
0.8
0.9
1.0

Ideally, OKR scores fall between 0.6 to 0.7 (60 to 70 percent). If scoring below 0.6, your team is underperforming. If consistently scoring above 0.7 or completing 100 percent of the results, your goals might be insufficiently ambitious
As an example, let us say you want to determine the Monthly objective score from Obj1, that has 3 KRs.
Obj1 score = (KR1 + KR2 + …+ KRn-1 + KRn)/Amount of KRs
What about tools?
Here are some examples:
![]()
Microsoft Excel Sheet
![]()
SmartSheets have good templates set for OKRs.
![]()
Trello. Leveraging cards and the waterfall chart.
![]()
Hive.
Note from the author
As a SAFe certified, and a person that enjoys the Scaled Agile Framework, it is always great to revisit the SAFe material that presents the Strategic Themes that connects the enterprise strategy to the portfolio vision. In there you will also find the relationship between Value Stream KPIs and the Strategic Themes.
Why this is relevant to the topic in this article is because the two (2) frameworks are linked together, complimenting each other, as OKRs are directly or indirectly related to the KPIs (See the image below).
If you want to read about this connection, then follow the value stream kpis link.
 |
| Value stream KPIs are derived from strategic themes and local concerns |


