


Introduction
Recently I worked on a redesign of one of my client’s mobile website. One of the key challenges I encountered was to test the new features of the mobile-only website on the emulators. This is because there are some new features which is hard to test without an actual device.
Therefore I decided to debug the mobile site by using an actual device connected to a laptop and using Chrome as the tool for it. But I encountered new challenges. One of them being the device not getting recognized for debugging and not even showing in the Windows Device Manager.
In this article we are focusing on the Android side of things. I used the following tools:
- A PC laptop (with window 7 and above)
- An Android phone. (I used a Samsung Galaxy S5 Neo)
- Browser: Chrome
This is not a step by step article for debugging the apps as you can find that in the reference provided here. This article is my personal experience when going through the debugging exercise, items that you might not find in the reference links, so please consider this as an extended documentation that might help your website and it’s new features.
Before starting:
- You might find some trouble when you are connecting your smartphone as it may not get recognized by your PC. For that reason I placed this link in the reference section at the end of this article.
- If you are looking for documentation on debugging using your device I strongly advise you to follow the guidelines in here under the reference section.
Here are the lessons learned based on what happened during the debugging:
1. Make sure you have the right cable as not all cables can be used for debugging. As I tried to debug the mobile website with the Android device, the computer was unable to recognize the smart phone. This was after installing the USB drivers that I downloaded. The smart phone was charging as it was connected, and the laptop was flagging that device as connected, but I was unable to use the device for instance I wasn’t able to access the media files in it or see it in the Device Manager from Windows. Therefore I decided to change my cable and BOOM! - It worked.
2. Sometimes you may need to get the the latest Chrome browser. Or others may recommend getting the Chrome Canary version which is a different from what you would normally install. Canary is a one of the different releases Chrome may have in their roadmap with features that are still not in the current production release however it is not well tested.
3. I don’t want to repeat the wheel or take credit for a well documented process. So I would advice you to follow the android instructions: https://developer.chrome.com/devtools/docs/remote-debugging
3b. If you are debugging then in order to make your life easier, chances are you will need it eventually, so download the Android Studio and the SDK at:
https://developer.android.com/studio/index.html Follow instructions and install.
4. Go to your Device Manager and make sure the device is appearing in:
1. Modems. ex Samsung Mobile USB Modem as shown below
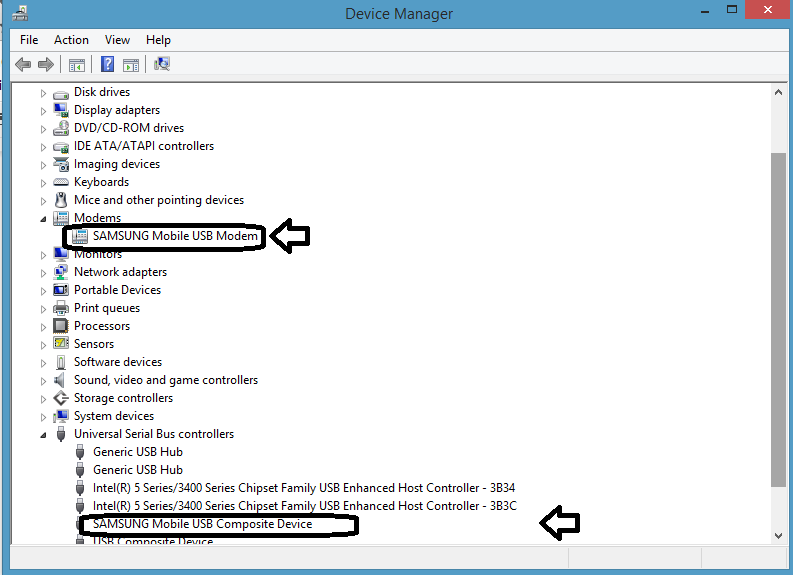
2. as it's own device: Samsung Android Phone
3. inside Universal Serial Bus Controllers. Ex. Samsung mobile USB Composite Device. See image above.
Note: if you cannot see your device as a media to transfer files, something is definitely wrong. So go back to item list 1 and 4, until you get it working. Perhaps getting the correct driver, if Microsoft updates do not work for you when you connect the device. Be patient, Microsoft screen will take a while to get the drivers (from 1 mins to 5 mins., but eventually believe that something is happening. If it takes longer than that cancel and repeat. If repeating does not work, then download the drivers and install. And then retry the steps again).
5. Once your device is recognized by your laptop then you are on the right track.
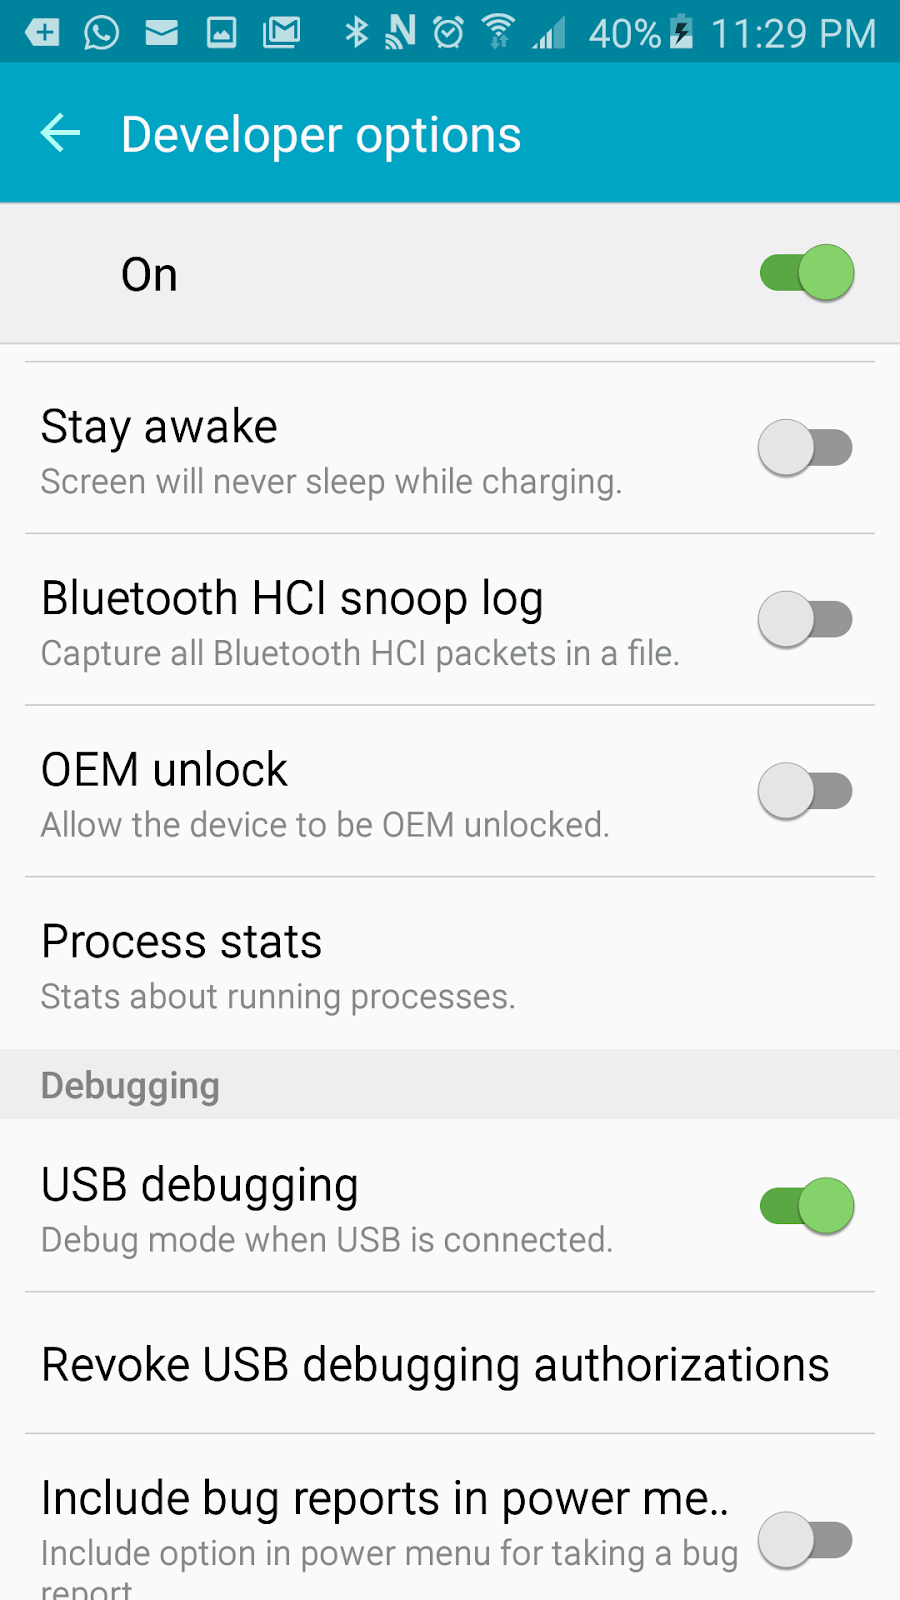
Make sure you follow the android steps for debugging. Specially turning your device developer mode and USB debugging:
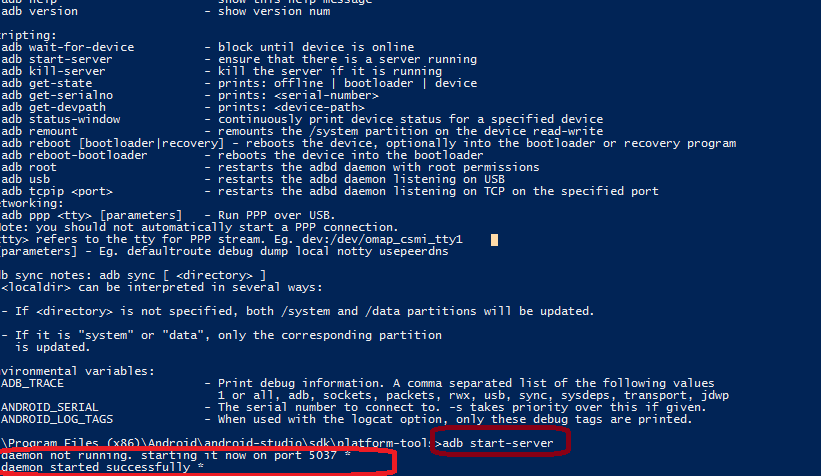
At this point then open the explorer. Look for the Android folder, normally in the program files folder. Then go to sdk > platform-tools folder. You will find the adb.exe. Do the following:
5.1) copy the location path
5.2) load powershell or cmd
5.3) CD [location path copied]
5.4) run command “adb start-server” .
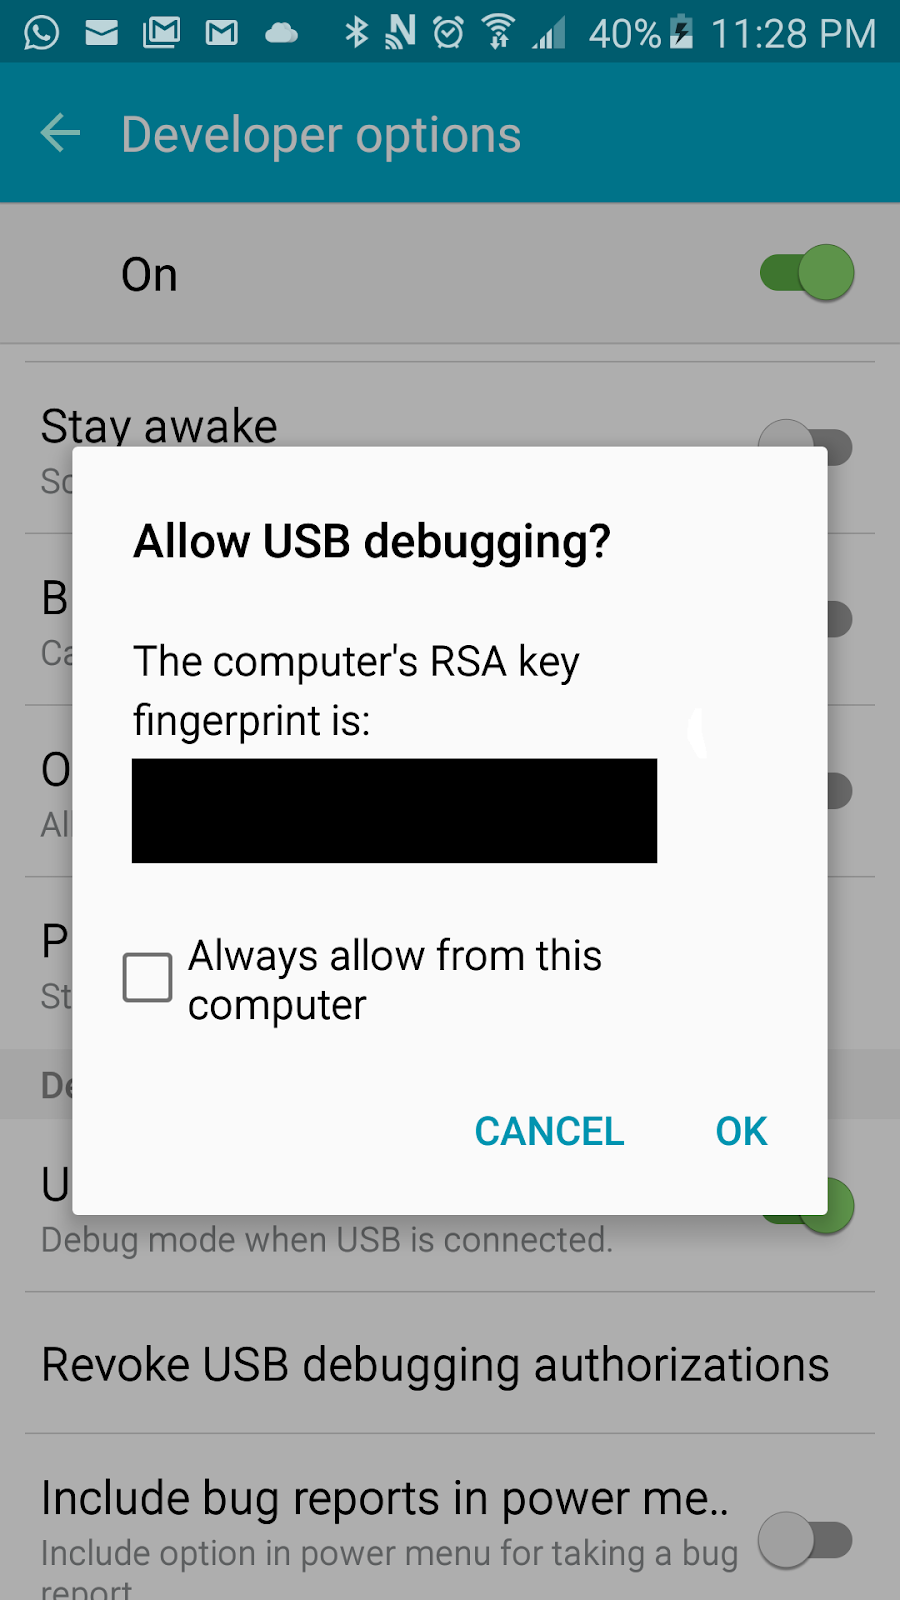
If your phone is connected it should prompt the screen of "Allow USB debugging" with the computer RSA key fingerprint (the same that you would see at the "Discovering devices in chrome" section in this link).
6. Now if you go to chrome://inspect/#devices on your chrome PC you should see the device if "Discover USB devices" is selected as shown below.
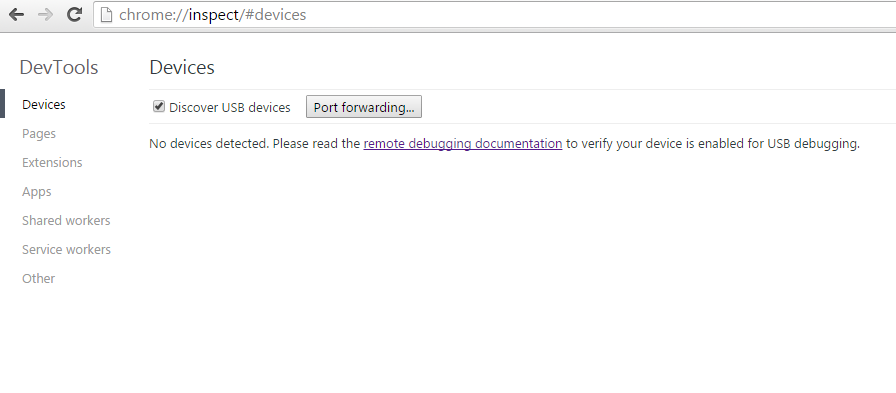 |
| Screen when no devices found |
In this example I’m loading google.ca on the phones browsers. At this point I’m able to inspect it using Chrome Developer Tools:
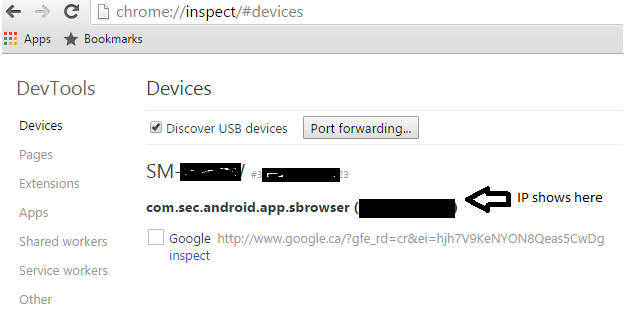 |
| Screen when devices found |
Final notes:
When you are done debugging and you would like things the way they are then:
- Go to the command prompt (or to powershell) and run the command “adb kill-server”. When you do this, if you go to the chrome inspect devices you will no longer see the mobile device.
- Finally go to your device and turn off:
- USB debugging
- Developer option off as well
References:
Install USB Drivers:
Remote debugging:
Device mode and mobile emulation:
Dev tools:


